
Using KPI dashboards to drive website growth and user engagement involves tracking and visualizing key performance indicators that reflect how users interact with your website, enabling data-driven decisions to optimise user experience and business outcomes.
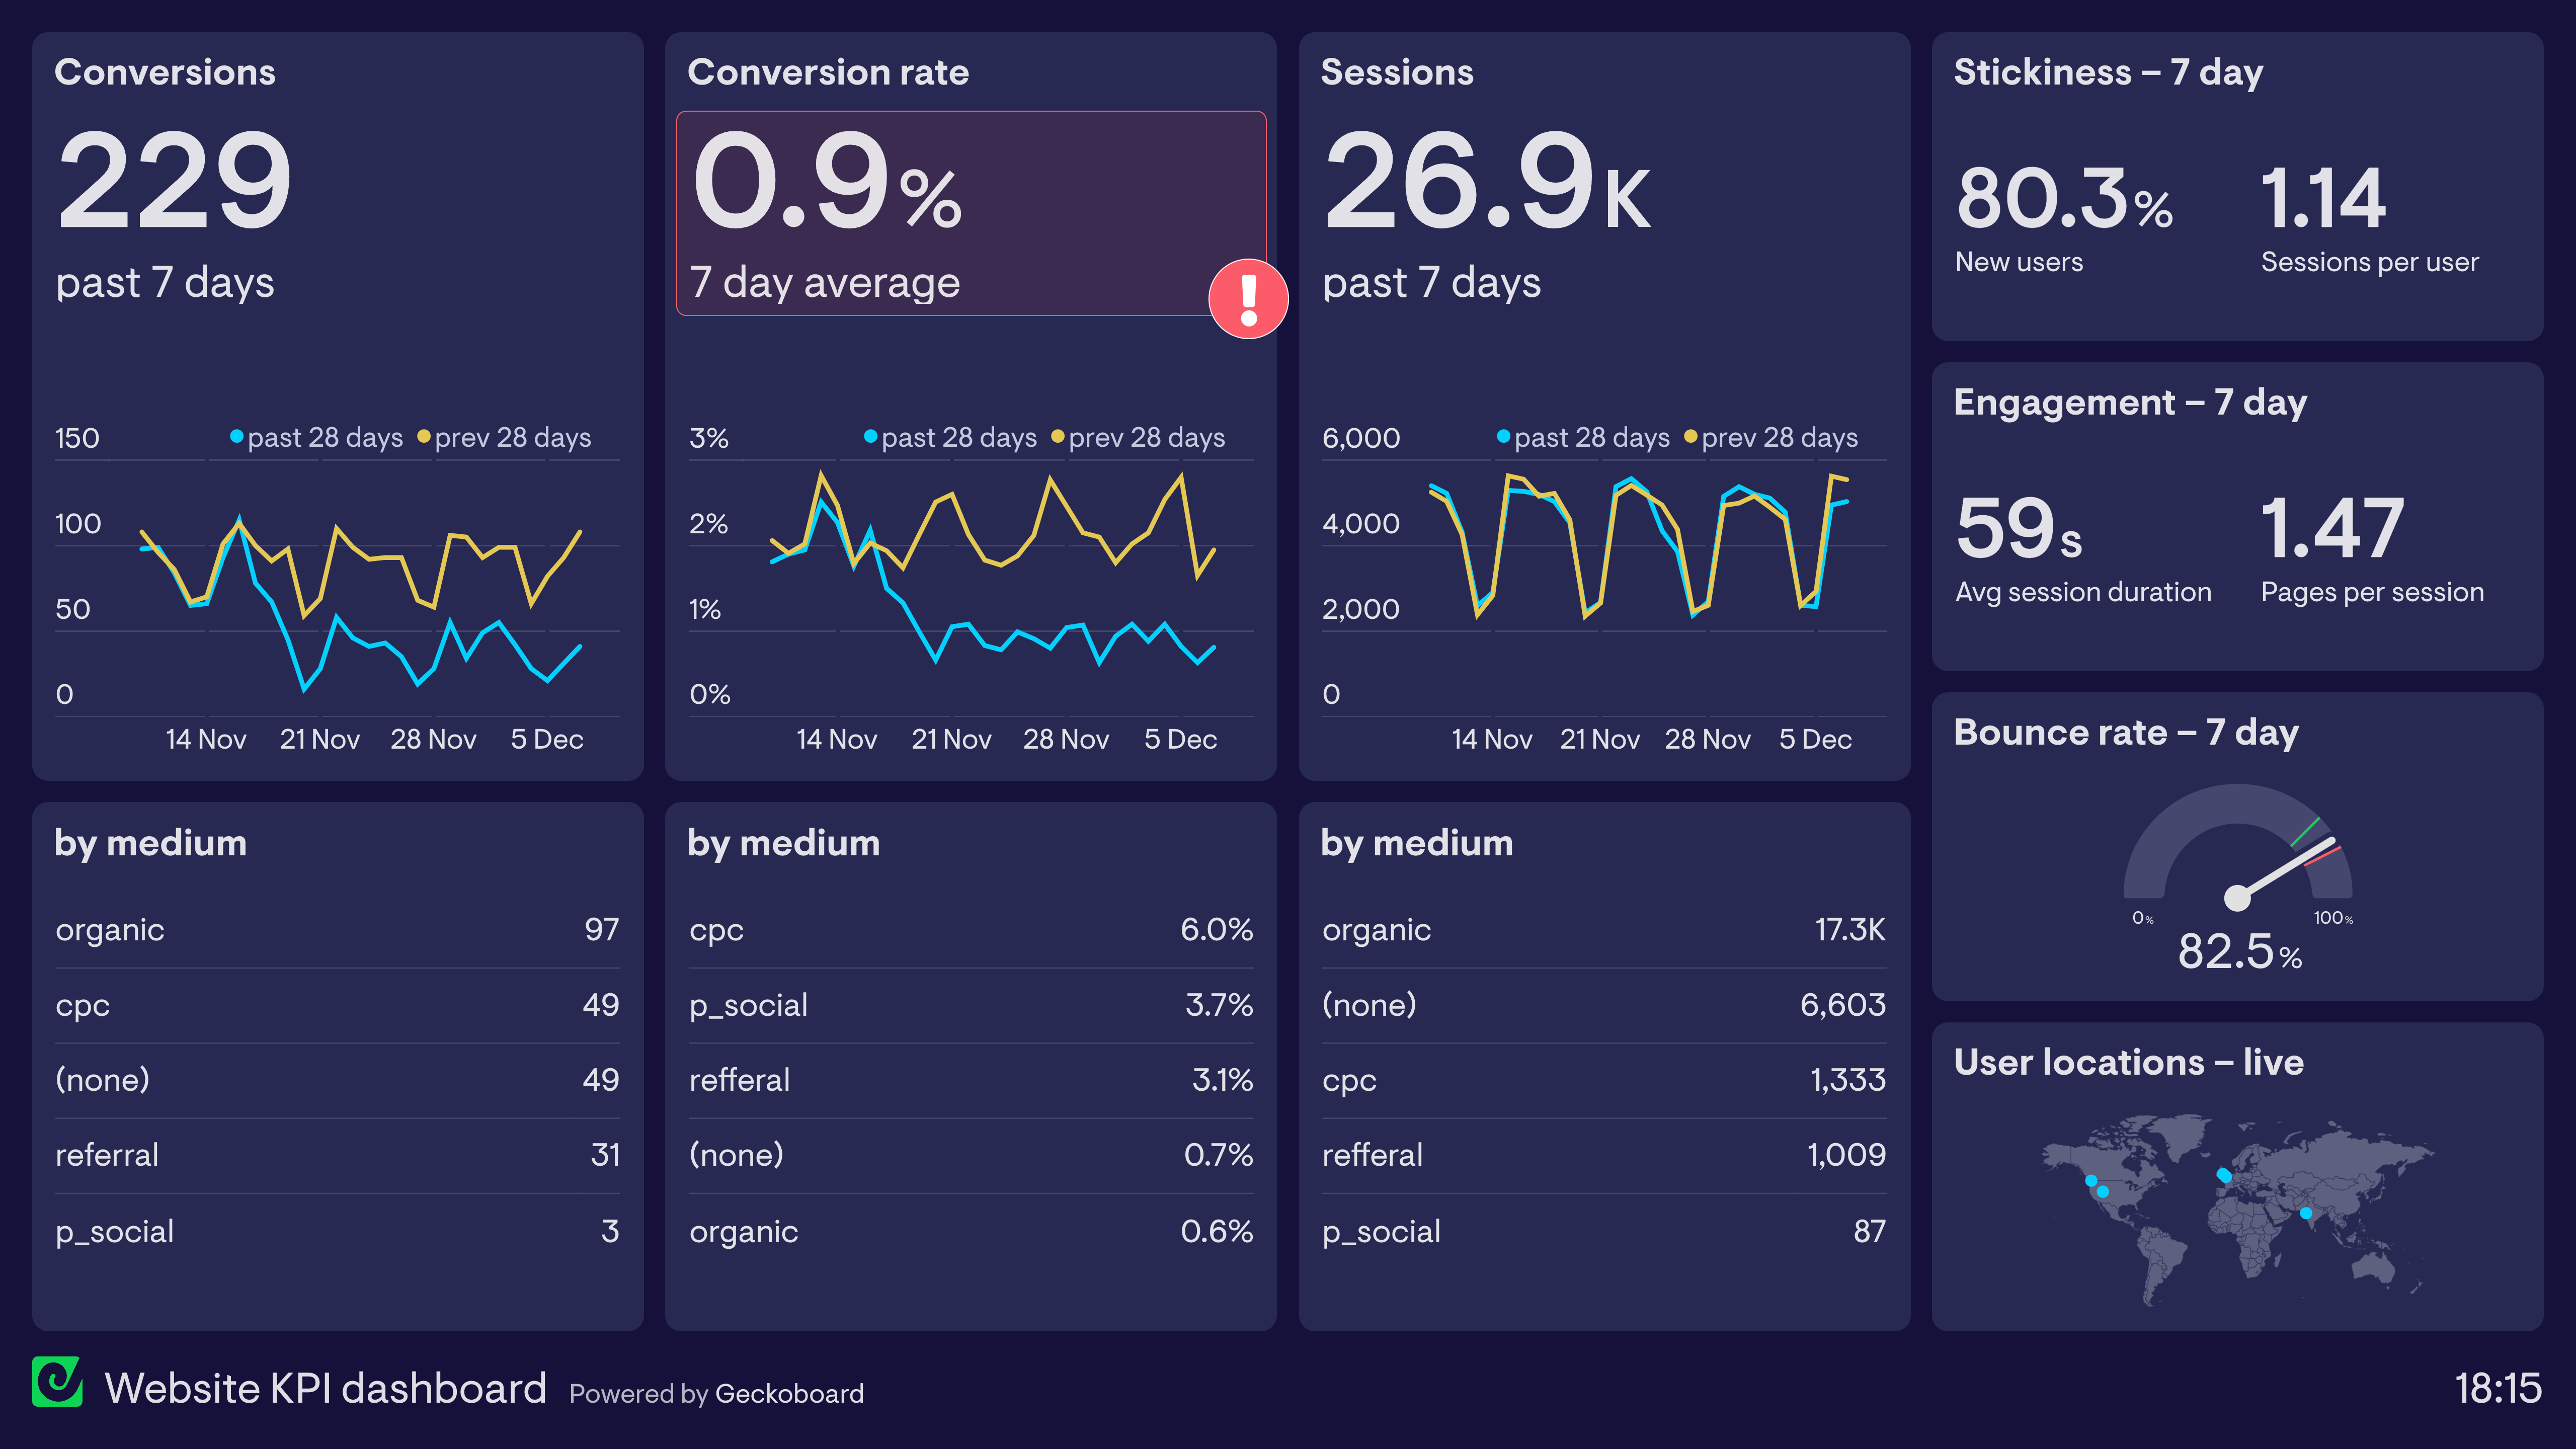
KPI dashboards consolidate critical metrics such as website traffic, user retention, session duration, conversion rates, and feature usage into real-time, easy-to-understand visual formats accessible across teams. This transparency fosters a shared understanding of performance and helps identify trends, strengths, and areas needing improvement.
Key ways KPI dashboards drive website growth and engagement include:
-
Monitoring User Activity: Dashboards track metrics like daily active users, session length, and retention rates, revealing how engaged visitors are and where drop-offs occur.
-
Optimizing Content and Features: By analyzing pageviews, average time on page, and feature usage, teams can refine content and product features to better meet user needs and increase time spent on site.
-
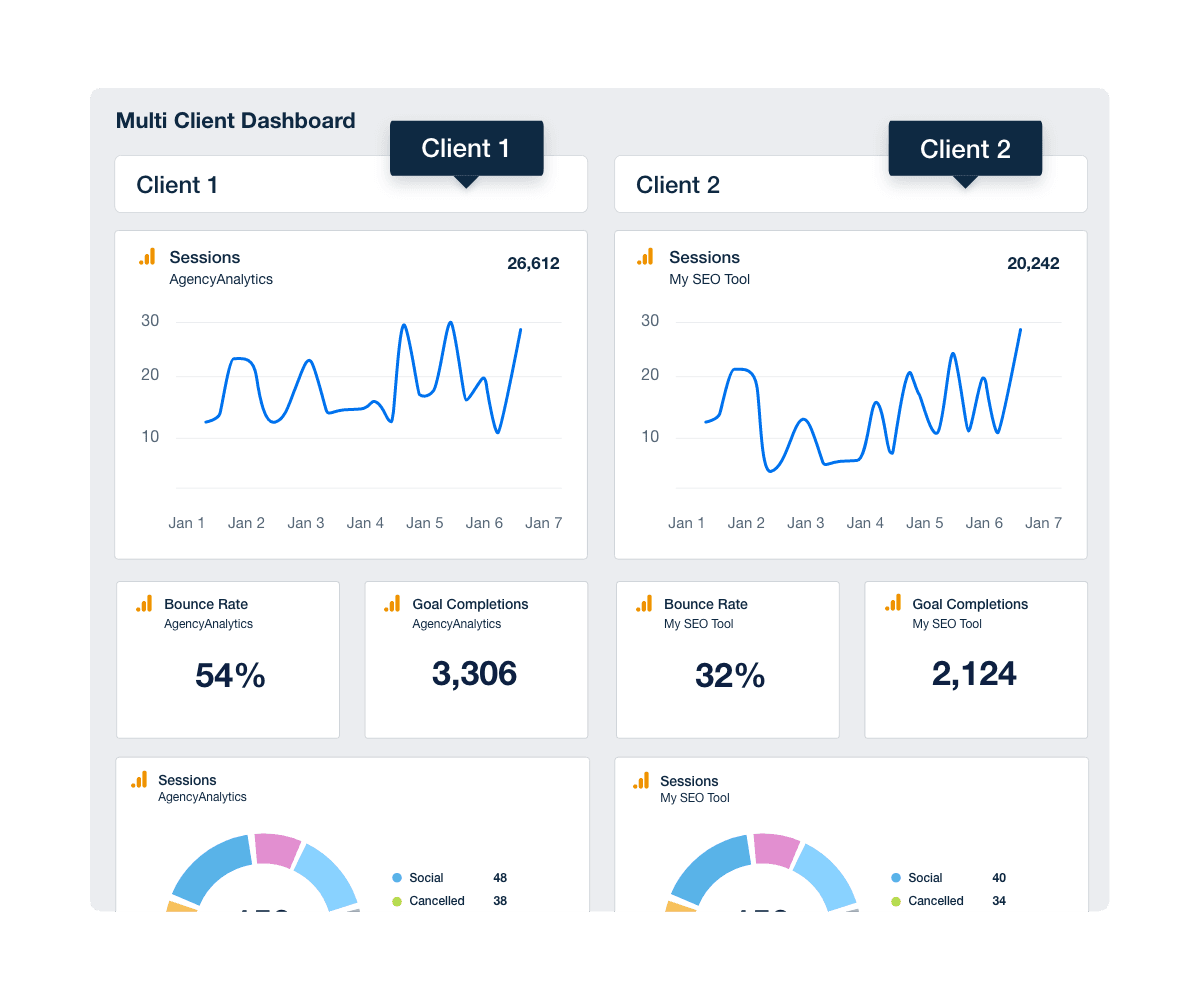
Aligning Teams Around Goals: With accessible dashboards, marketing, sales, product, and management teams share a unified view of performance, enabling coordinated strategies to boost growth and engagement.
-
Driving Data-Driven Decisions: Real-time insights allow quick adjustments to campaigns, UX, or product offerings based on actual user behaviour, improving conversion rates and retention.
-
Setting Realistic Targets: Historical data on traffic and engagement helps set achievable growth goals and plan marketing efforts effectively, such as timing promotions during slow periods.
Common KPIs to include in such dashboards for website growth and engagement are:
- Website traffic and unique visitors
- Bounce rate and exit rate
- Session duration and pages per session
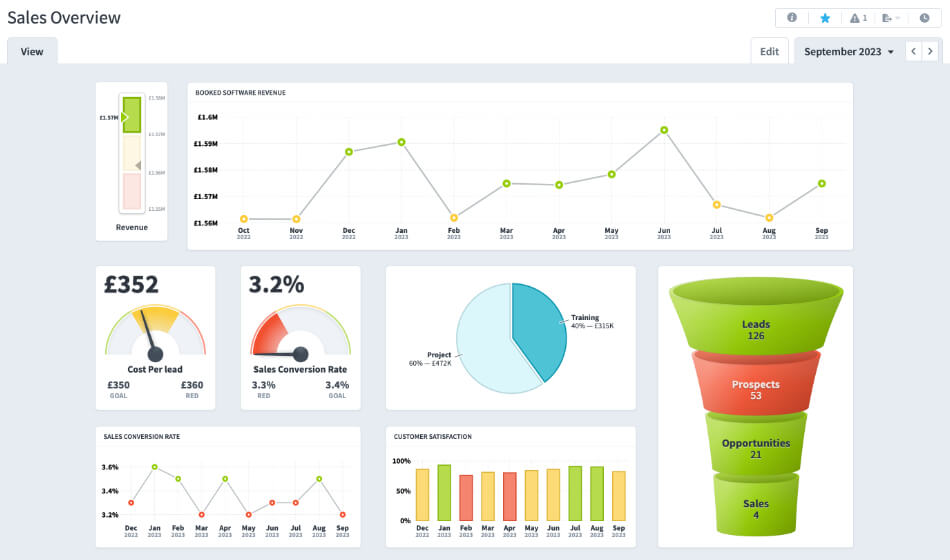
- Conversion rates (e.g., sign-ups, purchases)
- User retention and churn rates
- Feature usage and customer support inquiries (for SaaS or product sites)
- Lead generation metrics (for sales-focused sites)
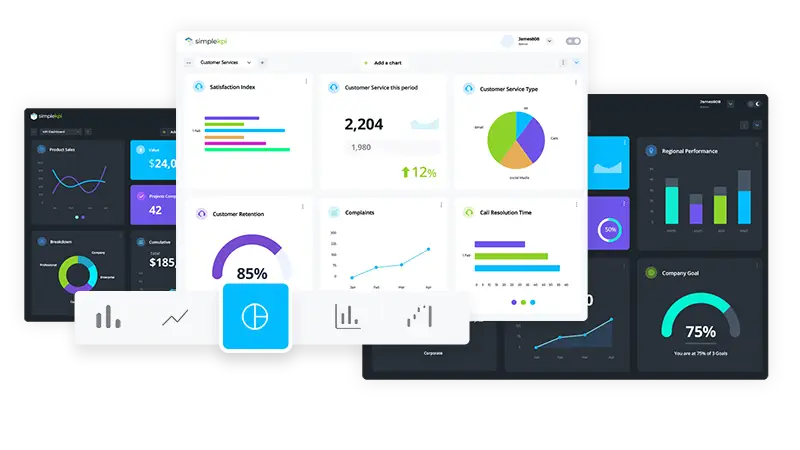
Best practices for KPI dashboards emphasize simplicity, clarity, and interactivity—using clean layouts, intuitive navigation, and visualizations like line graphs and bar charts to highlight trends and comparisons. Interactive elements allow users to drill down into data for deeper insights.
In summary, KPI dashboards serve as a central tool to measure, understand, and improve website growth and user engagement by turning complex data into actionable insights that align teams and guide strategic decisions.


WebSeoSG offers the highest quality website traffic services in Singapore. We provide a variety of traffic services for our clients, including website traffic, desktop traffic, mobile traffic, Google traffic, search traffic, eCommerce traffic, YouTube traffic, and TikTok traffic. Our website boasts a 100% customer satisfaction rate, so you can confidently purchase large amounts of SEO traffic online. For just 40 SGD per month, you can immediately increase website traffic, improve SEO performance, and boost sales!
Having trouble choosing a traffic package? Contact us, and our staff will assist you.
Free consultation