
Measuring ROI from Instagram Reel Views to Website Traffic and Sales
To measure ROI from Instagram Reels, track the chain from views to click-throughs, website traffic, conversions, and revenue, then apply the formula: ROI % = (Revenue generated - Total costs) / Total costs × 100%. Costs include content creation time, ad spend (if boosted), and tools; revenue factors in direct sales plus customer lifetime value (LTV).
Key Steps to Convert Views into Measurable Traffic and Sales
- Add Trackable Links: Use Instagram's "Link in Bio" tools (e.g., Linktree) or Stories/Reels stickers for direct links. Append UTM parameters (e.g., ?utm_source=instagram&utm_medium=reels&utm_campaign=promo) to tag traffic in Google Analytics 4 (GA4).
- Assign Unique Promo Codes: Give each Reel a custom discount code (e.g., REEL10) to attribute sales directly—track code usage, average order value, and total revenue.
- Boost for Attribution: Promote high-performing Reels as ads to enable pixel tracking for events like website visits and purchases.
- Monitor Multi-Touch Paths: Use GA4's attribution models to credit Reels for assisted conversions, not just direct clicks.
Essential Metrics to Track (in Funnel Order)
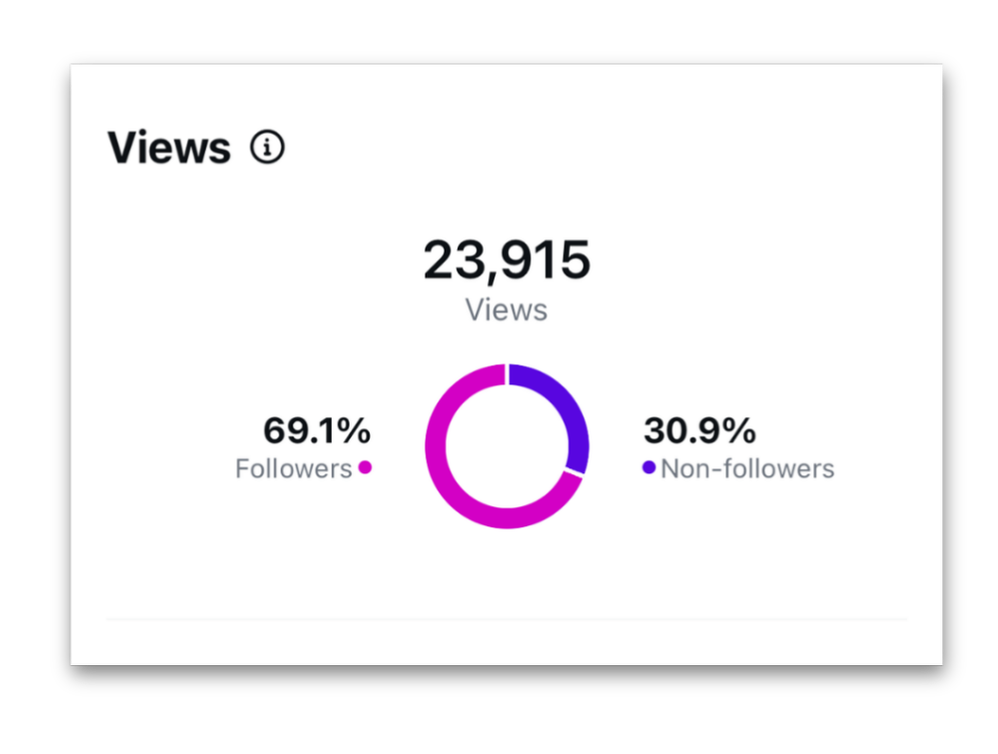
Use Instagram Insights for Reel-specific data (views, reach, watch time) and GA4 for post-click performance.
| Metric | Formula | Why It Matters for ROI | Benchmark Goal |
|---|---|---|---|
| Reel Views | Total plays (even 0.1s counts in 2025) | Indicates exposure; high views + low engagement signals poor resonance. | N/A (contextual) |
| Engagement Rate | (Likes + Comments + Shares + Saves) / Views × 100 | Predicts click potential; aim for content that hooks in first 3s. | >3-5% |
| Click-Through Rate (CTR) | Clicks / Views or Impressions × 100 | Measures traffic from views; low CTR means weak calls-to-action. | >1-2% |
| Website Sessions/Users | GA4 sessions tagged from Reels | Direct traffic volume; track bounce rate and session duration. | N/A |
| Conversion Rate | Purchases or Leads / Website Visitors × 100 | Traffic-to-sale efficiency. | >2-5% (varies by industry) |
| Revenue per Reel | Total sales value from attributed traffic/codes | Ties to LTV and repeat buys. | N/A |
| ROAS | Revenue / Campaign Cost × 100 | Quick profitability check; aim for 300%+ (3:1). | >300% |
| Cost Per Acquisition (CPA) | Total Cost / New Customers | Ensures scalability. | Below LTV |
Calculating Full ROI Example
- Reel gets 10,000 views; 200 clicks (2% CTR); 100 sessions; 5 sales at $50 each ($250 revenue).
- Costs: $100 (creation + boost).
- ROI = ($250 - $100) / $100 × 100% = 150%. Account for indirect value like follows, profile visits, and brand lift via completion rate (views that watch to end). Promo codes capture ~3:1 ROI successes but miss code-free buyers.
Best Practices and Limitations
- Unify Data: Dashboards combining Instagram Insights, GA4, and sales platforms for holistic view.
- Test & Optimize: A/B test hooks, post timing, and CTAs; high watch time (>50% completion) boosts algorithm reach.
- Limitations: Organic Reels rarely drive instant sales (focus on awareness); attribution misses view-only impact; undercounts if users buy later. For precision, combine with affiliate links or pixels. Industry benchmarks vary—e.g., e-commerce targets 3-4x ROAS, complex products 12x+.


WebSeoSG offers the highest quality website traffic services in Singapore. We provide a variety of traffic services for our clients, including website traffic, desktop traffic, mobile traffic, Google traffic, search traffic, eCommerce traffic, YouTube traffic, and TikTok traffic. Our website boasts a 100% customer satisfaction rate, so you can confidently purchase large amounts of SEO traffic online. For just 40 SGD per month, you can immediately increase website traffic, improve SEO performance, and boost sales!
Having trouble choosing a traffic package? Contact us, and our staff will assist you.
Free consultation