
The key metrics that matter for measuring success on Instagram Stories fall into three main categories: Discovery, Navigation, and Engagement (Interactions).
-
Discovery Metrics
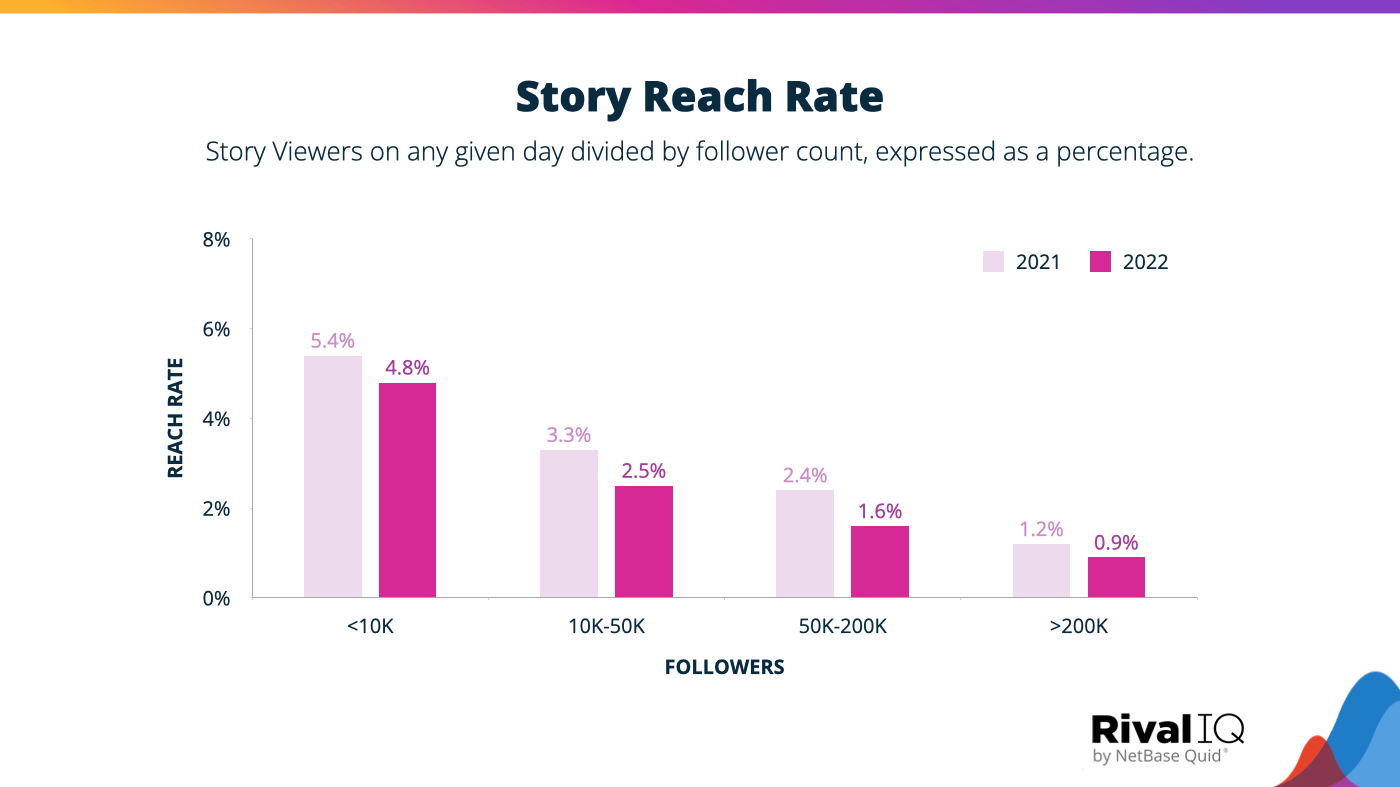
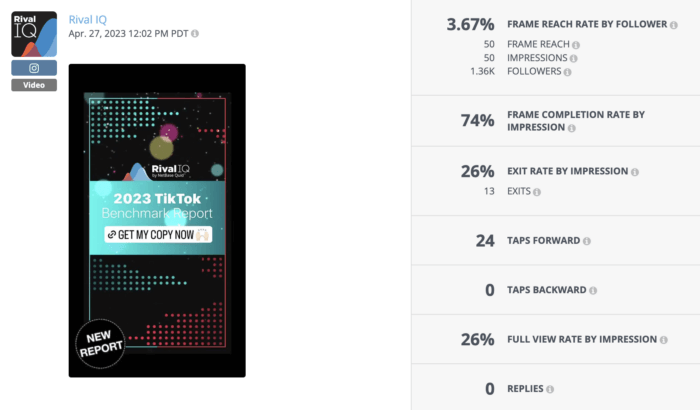
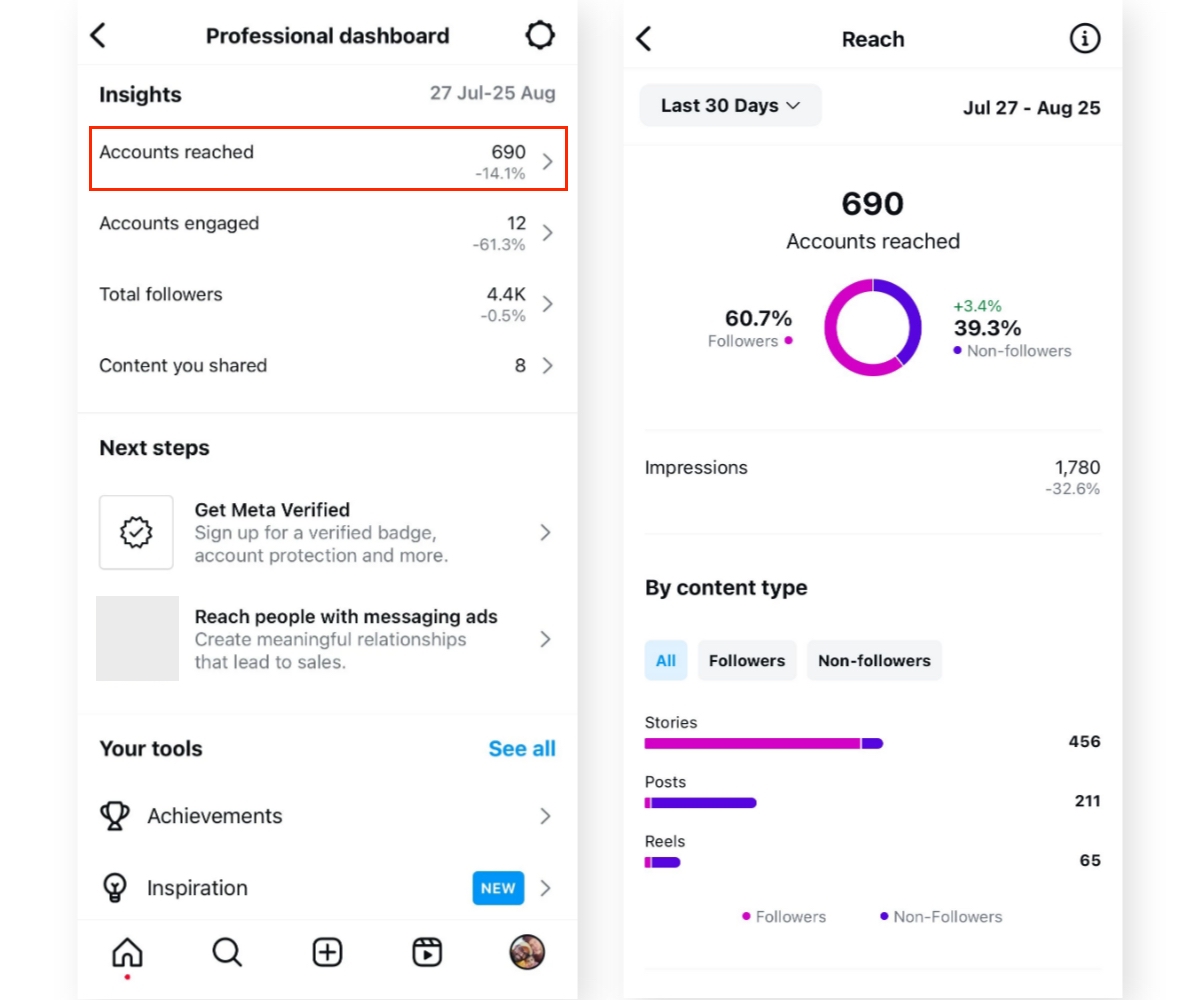
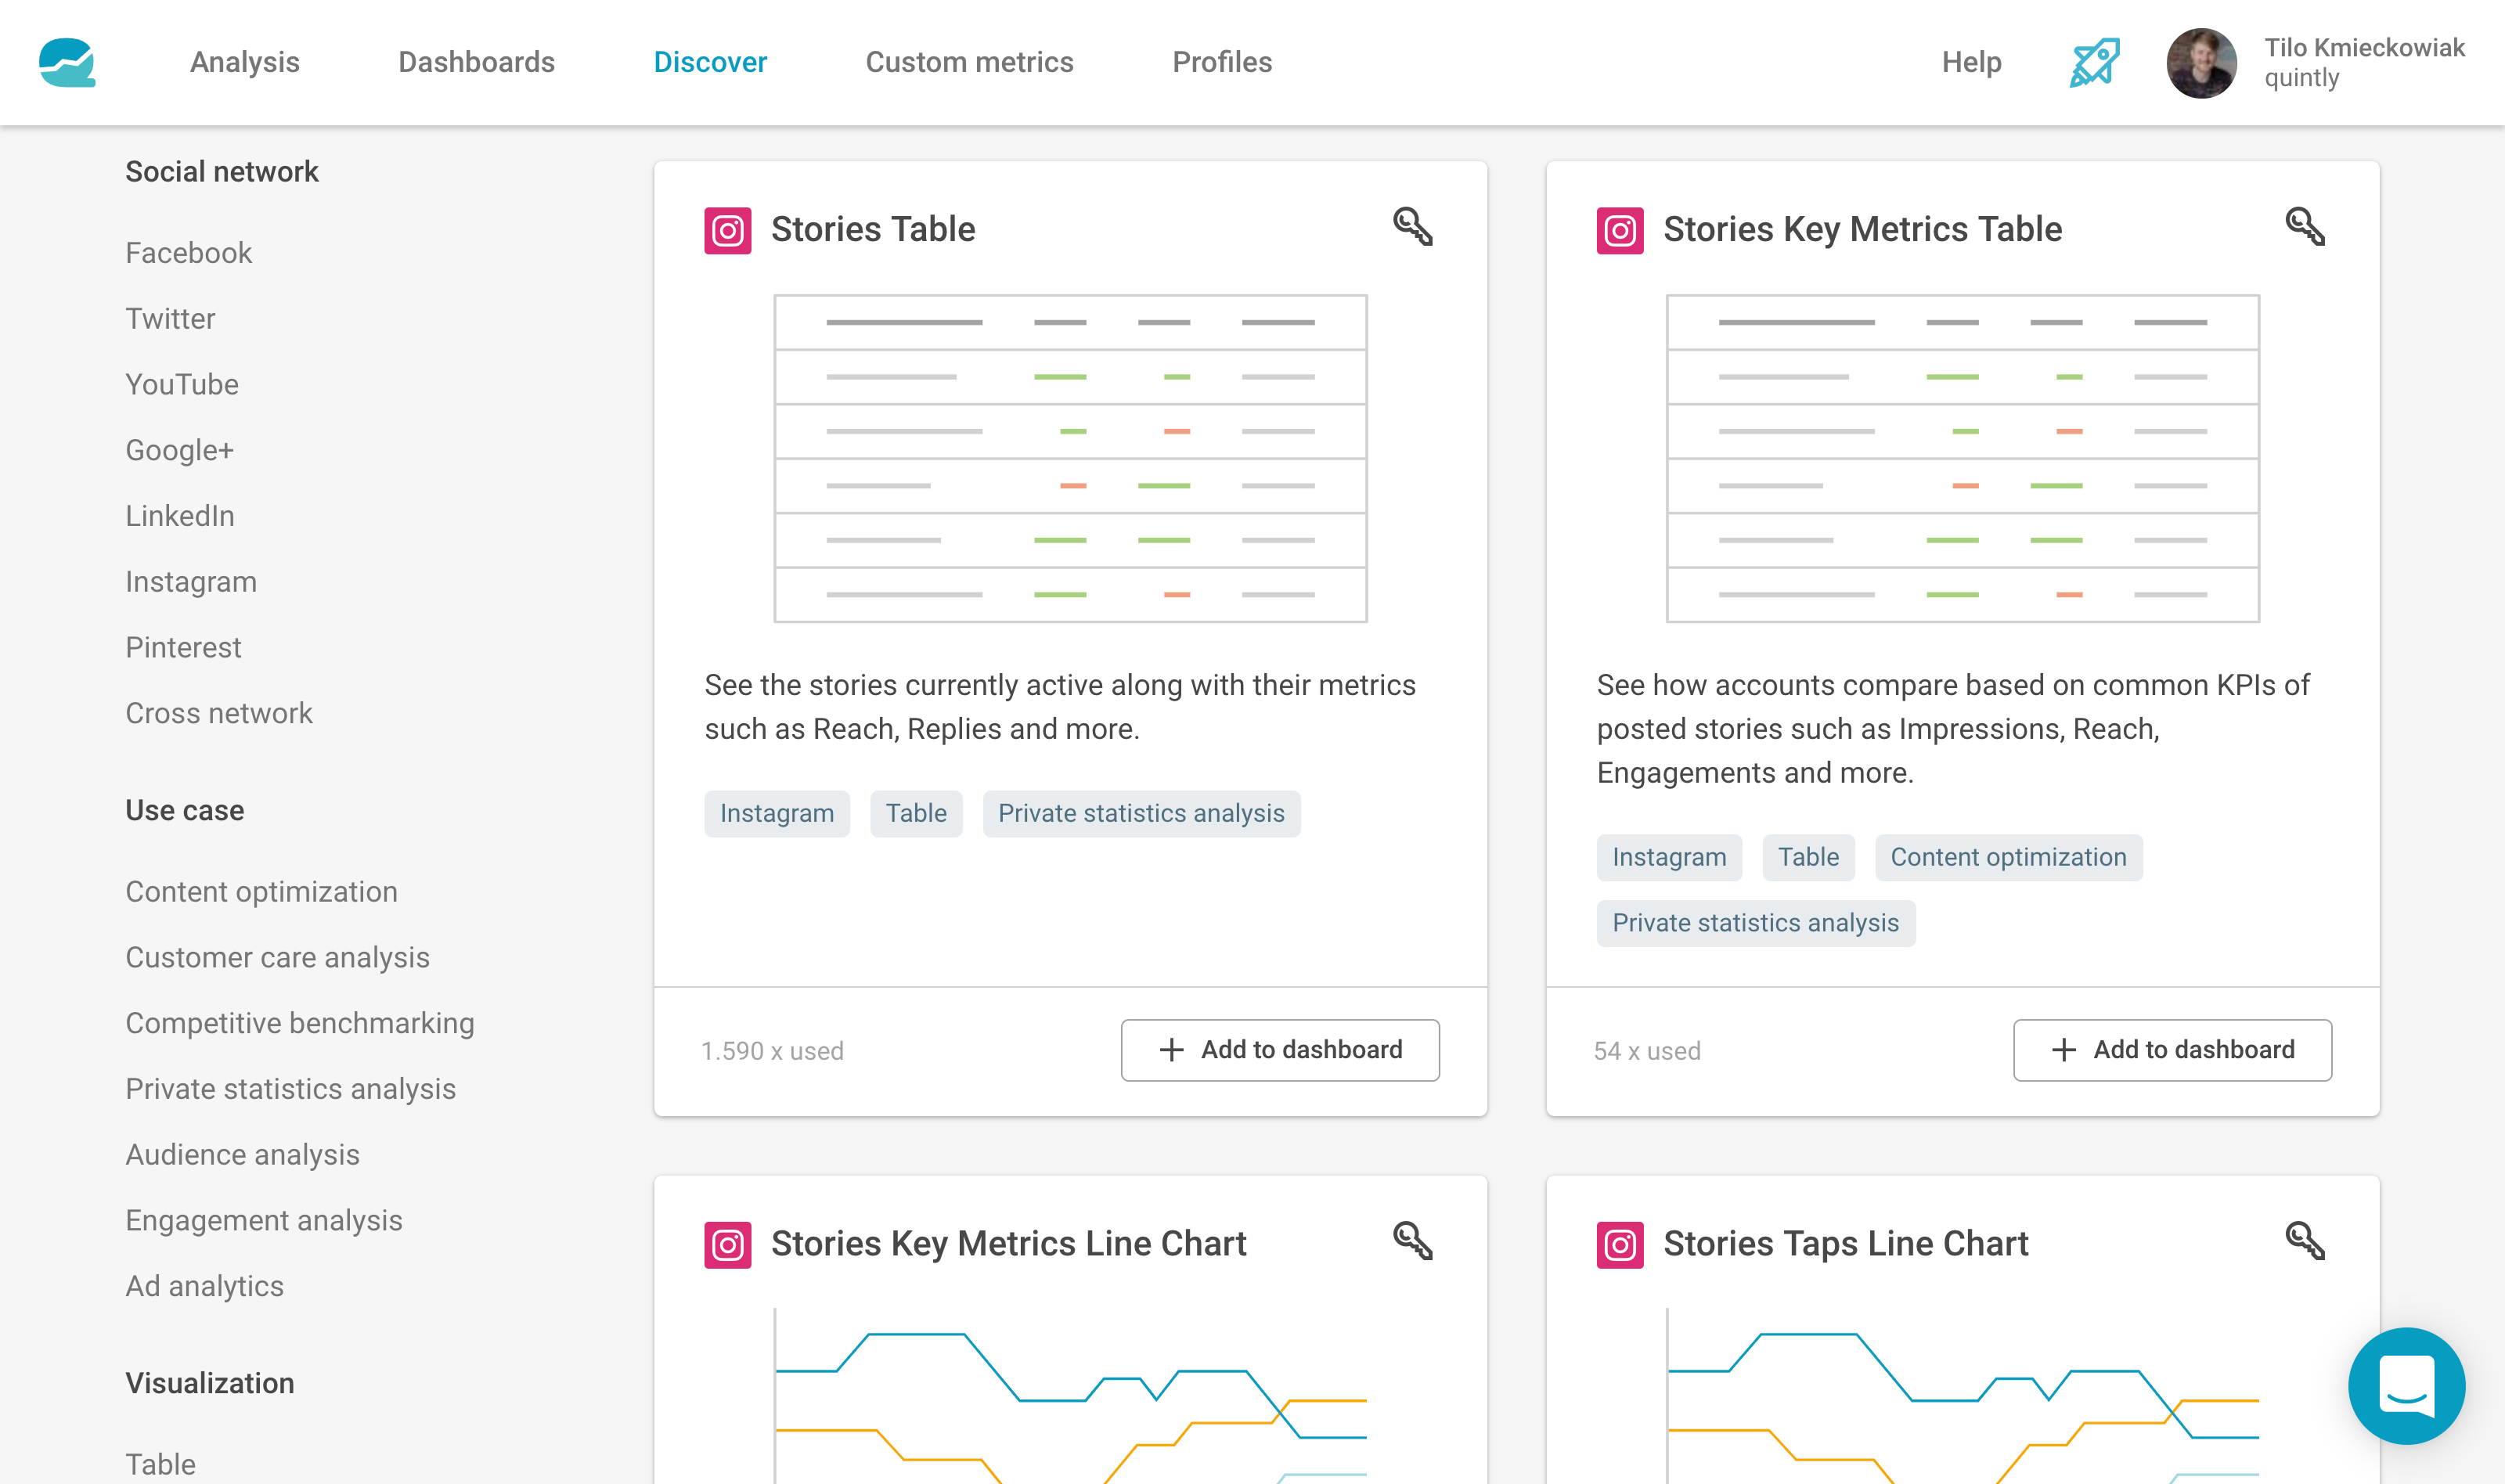
- Reach: Number of unique accounts that viewed your Story. It shows how many people your content is reaching and is crucial for brand exposure.
- Impressions: Total views including repeat views. High impressions relative to reach indicate engaging content that viewers rewatch.
- Follows: Number of new followers gained from your Stories, indicating brand awareness growth.
- Sticker Taps: Taps on hashtags, location tags, mentions, or product stickers, which can increase discoverability and engagement.
These metrics help you understand how widely your Stories are seen and how effectively they attract new viewers.
-
Navigation Metrics
- Forward Taps: Number of taps to the next Story, showing progression through your content.
- Back Taps: Taps to rewatch the previous Story, indicating content viewers want to see again.
- Next Story Swipes: Swipes to skip your Story, a sign of disengagement.
- Exit Story Taps: Number of times viewers exit your Story early, highlighting where interest drops off.
Navigation metrics reveal how viewers interact with your Story flow and help identify which parts hold attention or cause drop-off.
-
Engagement (Interaction) Metrics
- Replies: Number of direct responses to your Story, showing active viewer engagement.
- Profile Visits: How many viewers visit your profile from your Story, indicating interest in your brand.
- Sticker Interactions: Engagement with polls, questions, emoji sliders, or other interactive stickers, which boost engagement and provide feedback.
These metrics measure how viewers engage beyond passive viewing and can guide content that encourages interaction.
-
Additional Important Metrics
- Completion Rate: Percentage of viewers who watch your entire Story sequence, reflecting content engagement and effectiveness. A high completion rate suggests compelling content.
- View Rate: Percentage of your followers who viewed your Story (views divided by followers), useful for comparing Story performance relative to audience size.
- Shares: How often your Story is shared by viewers, indicating highly engaging or valuable content.
Tracking and analysing these metrics allows you to understand your audience’s behaviour, optimise content for better engagement, increase reach, and ultimately measure the ROI of your Instagram Stories efforts effectively.


WebSeoSG offers the highest quality website traffic services in Singapore. We provide a variety of traffic services for our clients, including website traffic, desktop traffic, mobile traffic, Google traffic, search traffic, eCommerce traffic, YouTube traffic, and TikTok traffic. Our website boasts a 100% customer satisfaction rate, so you can confidently purchase large amounts of SEO traffic online. For just 40 SGD per month, you can immediately increase website traffic, improve SEO performance, and boost sales!
Having trouble choosing a traffic package? Contact us, and our staff will assist you.
Free consultation